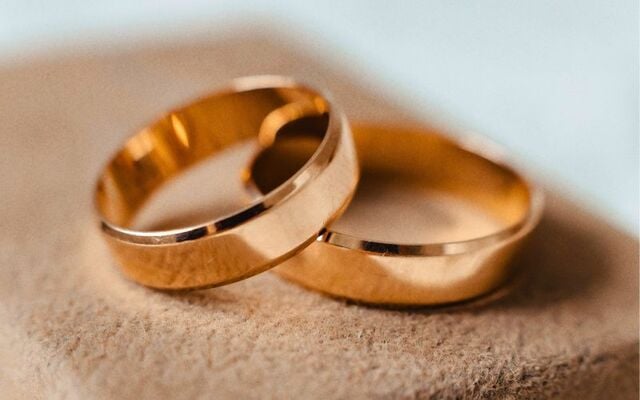
There were 19,898 marriages registered in Ireland in 2025, a decrease of 9.7% from the 22,025 marriages registered in 2015.
The decrease is highlighted in Ireland's Central Statistics Office's (CSO's) report on marriages in Ireland in 2025, which was published this week.
The report noted that the number of marriages registered in Ireland in 2025 fell by 2.2% from 20,348 marriages in 2024.
Among the 19,898 marriages registered in Ireland in 2025, 624 were same-sex marriages, which also represented a decrease of 6.6% from the 668 same-sex marriages registered in 2024.
The marriage rate per 1,000 of population in Ireland in 2025 stood at 3.6, a decrease from 4.7 in 2015.
The number of marriages registered in Ireland continued to fall in 2025 with a 2% drop on 2024 figureshttps://t.co/XJeC5eWc33#CSOIreland #Ireland #VitalStatistics #VitalStats #Births #Deaths #Marriages #IrishBabiesNames #BoysNames #GirlsNames #BabyNames pic.twitter.com/MsUbgxWdUc
— Central Statistics Office Ireland (@CSOIreland) May 5, 2026
Ages of brides and grooms in Ireland in 2025
The average age of women in opposite-sex marriages in Ireland in 2025 was 36.1 years, an increase from 33.2 years in 2015.
Meanwhile, the average age of women in same-sex marriages in Ireland in 2025 was 38.1 years, down from 40 years in 2020.
The average age of men in opposite-sex marriages was 38.0 years in 2025, up from 35.3 years in 2015.
The average age of men in same-sex marriages in Ireland in 2025 was 40.6 years, slightly moving up from 40 years in 2020.
Wedding ceremony choice in Ireland
In 2025, the most popular form of ceremony for opposite-sex couples in Ireland was a civil ceremony at 6,304 or 32.7%, followed by a Roman Catholic ceremony at 5,927 or 30.8%.
Looking back 10 years, the proportion of Roman Catholic ceremonies for opposite-sex weddings has fallen from 56.7% (12,486 ceremonies) to 30.8% (5,927 ceremonies).
In 2025, the most popular form of ceremony varied across different parts of Ireland for opposite-sex couples. For instance, in 20 local authorities, a Roman Catholic ceremony was the most popular choice (Limerick County, Leitrim, Mayo, Longford, Roscommon, Offaly, Donegal, Monaghan, Laois, South Dublin, Cork County, Galway City, Clare, Waterford County, Kerry, Dun Laoghaire-Rathdown, Kilkenny, Tipperary, Westmeath, and Cavan).
But in 10 other local authorities (Galway County, Carlow, Sligo, Louth, Limerick City, Cork City, Wicklow, Waterford City, Wexford, and Dublin City), a civil ceremony was the most popular form of marriage.
For the remaining three areas (Fingal, Kildare, and Meath), most opposite-sex couples preferred other types of religious ceremonies.
For same-sex couples, 338 of the 624 ceremonies that occurred in 2025 were a civil ceremony (54.2%), followed by other religious-type ceremonies (28.5%).
Most popular months and days for weddings in Ireland
August was the most popular month for both opposite-sex and same-sex marriages in Ireland in 2025. January was the least favoured month to tie the knot for both opposite-sex marriages and same-sex marriages.
Friday and Saturday continue to be the most popular days for wedding ceremonies in Ireland for opposite-sex couples, while Friday, followed by Thursday, were the most favoured days to wed for same-sex couples.
For all couples, Sundays and Wednesdays were the least popular days of the week to marry.


Comments